Volatility in Indian Markets Is Not Random, It Comes in Regimes.
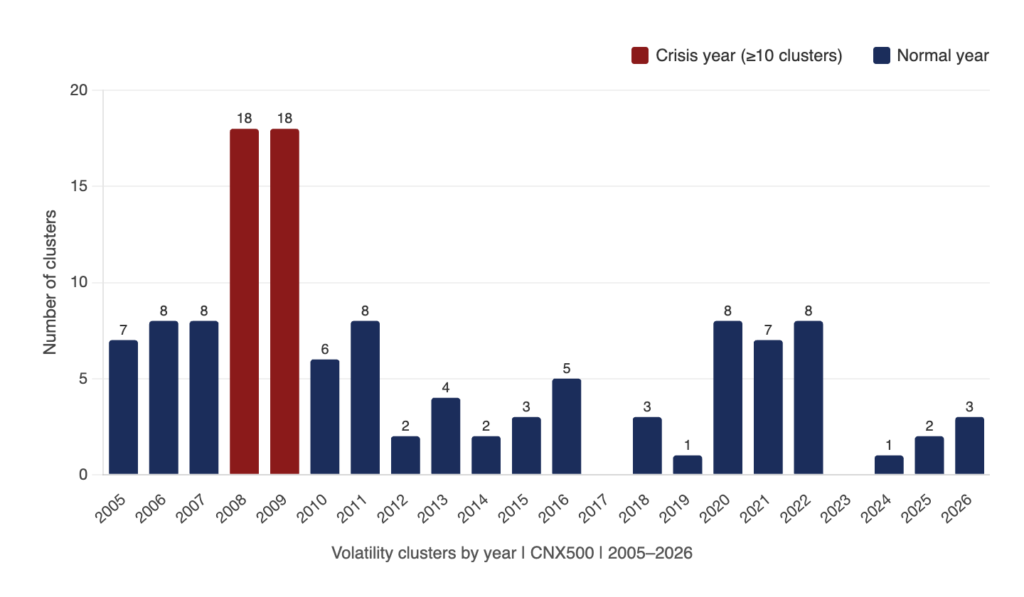
2008 had 18 volatile episodes, 2017 had zero and 2014 had two.
These are not random numbers. They are the output of 20 years of daily CNX500 data and they reveal something most investors never consider. Volatility in Indian markets does not arrive randomly spread evenly across trading days. It concentrates. It clusters into distinct regimes and the years that feel most dangerous are often followed by the years that reward patience most generously.
An analysis of 5285 trading days on the CNX500 index spanning January 2005 to April 2026 makes the case.
Volatility Comes in Regimes, Not Random Days
Every investor has lived through a volatile year and a calm year. What the data shows is that this is not random variation. It is a structural feature of Indian markets.
Over 20 years, the CNX500 produced 122 distinct volatility clusters defined as three or more consecutive trading days where the index moved more than 1% in absolute terms. These 122 clusters were not spread evenly. Crisis years concentrated the damage. 2008 and 2019 had 18 clusters, 2020 and 2022 had 8. Calm years had almost none. 2017 and 2023 had zero, 2014 had two.
The investor who entered 2018 having only experienced 2017 was structurally unprepared. The investor who understood that calm years are the exception rather than the norm and that volatile regimes arrive in clusters and then resolve was in a fundamentally different position.
What a Cluster Actually Looks Like
A volatility cluster is defined as 3 or more consecutive trading days where the CNX500 moves more than 1% in absolute terms ,either up or down.So if the index moves +1.5% on Monday, -2.1% on Tuesday, and +1.3% on Wednesday, that counts as one cluster. The direction doesn’t matter, only the size of the move.
A volatility cluster on average lasts 4.4 days. The median is 4 days. 79.5% of all clusters resolve within 5 trading days. A handful persisted and the longest in the dataset ran 18 consecutive days. But the overwhelming pattern is short, sharp, and over.Duration distribution
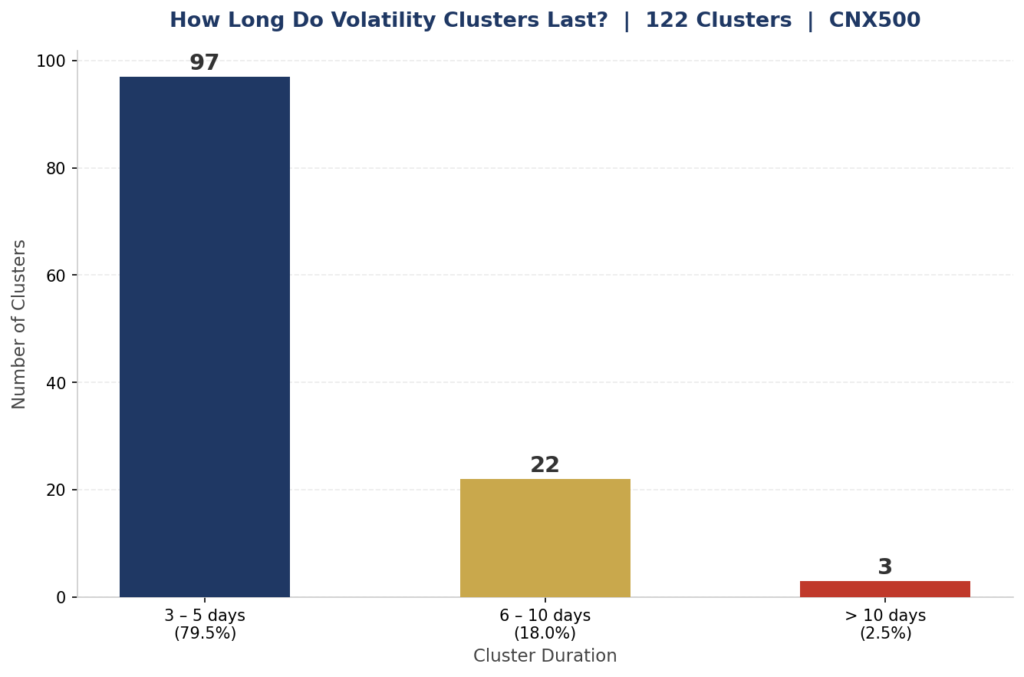
The worst cluster in the dataset was the COVID crash of March 2020 where CNX500 lost 17.37% across 11 consecutive high-volatility days. The second worst was October 2008, down 23.7% across 10 days. These are the extreme tail and the vast majority of clusters are far more contained.
This matters because the emotional experience of a cluster feels permanent. The data shows it is almost always temporary. The average cluster is 4 days of noise before markets stabilise.
What Each Asset Did During Clusters
The question that matters for portfolio construction is not just what the index did during clusters. It is what a three asset portfolio did,the analysis cross-references all 122 clusters with daily returns for CNX500, Gold (INR) and a liquid fund.
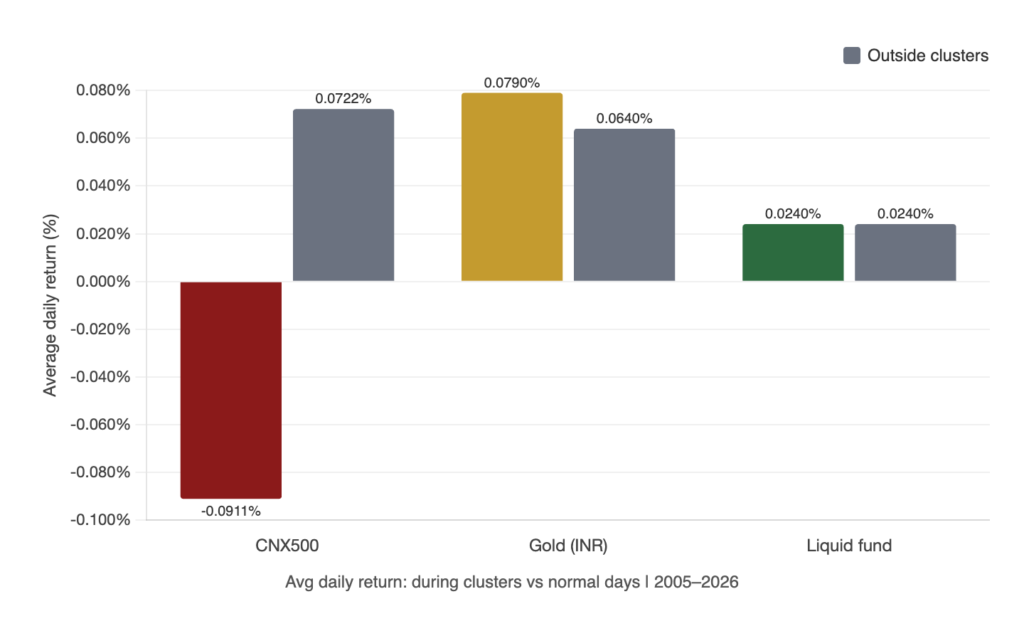
| Asset | Avg Daily Return Cluster Days | Avg Daily Return Outside Clusters | % Positive During Clusters |
|---|---|---|---|
| CNX500 | -0.0911% | +0.0722% | 38% |
| Gold (INR) | +0.0259% | +0.0661% | 56.5% |
| Liquid Fund | +0.0240% | +0.0240% | 100% |
During cluster periods, CNX500 averages a loss of 0.091% per day. Gold averages a gain of 0.026% and was positive on 56.5% of cluster days. The liquid fund delivered a positive return on every single cluster day in the 13 year dataset.
When CNX500 fell more than 3% during a cluster, gold was positive 62% of the time. The average CNX500 return during these severe clusters was -6.9%. The average gold return during the same periods was +0.34%.
The three assets do not move together. During the moments when equities are most stressed, the other two components of the portfolio tend not to be.
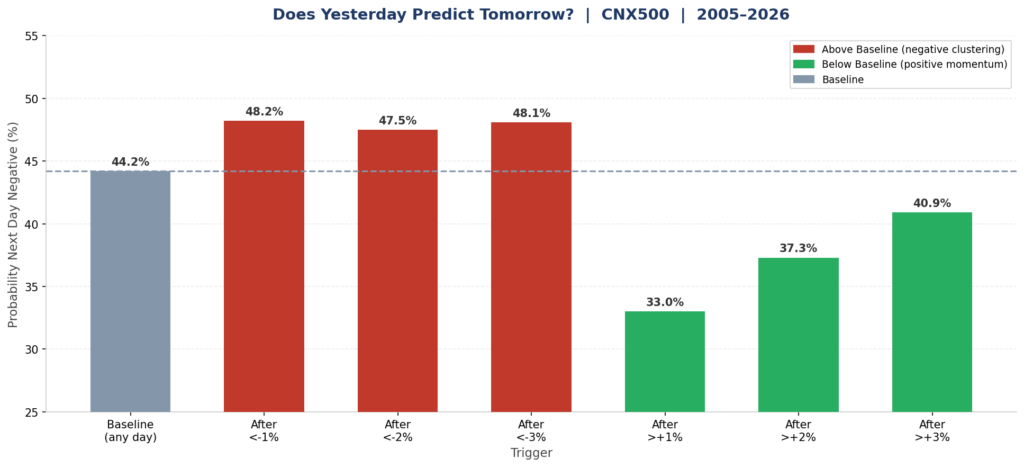
Beyond the regime and cluster analysis, the daily return data reveals one additional finding worth noting. On any random trading day, the probability of the CNX500 closing negative is 44.2%. After a day where the index falls more than 1%, that probability rises modestly to 48.2%, a 4 percentage point excess. Bad days do cluster at the daily level, but weakly.
The stronger finding runs in the other direction. After a day where CNX500 gains more than 1%, the probability of the next day being negative drops to 33%, an 11 percentage point gap below baseline. Positive momentum in Indian markets is measurably more persistent than negative momentum. Markets trending up tend to continue trending up more reliably than markets trending down tend to continue falling.Conditional probability table
After the Regime Ends
The most important question for an investor sitting inside a volatile period is not what is happening. It is what comes next.
The data tracks CNX500 and gold returns for every 1-month, 3-month and 6-month window beginning the day after each cluster ended. The findings are consistent across every timeframe.
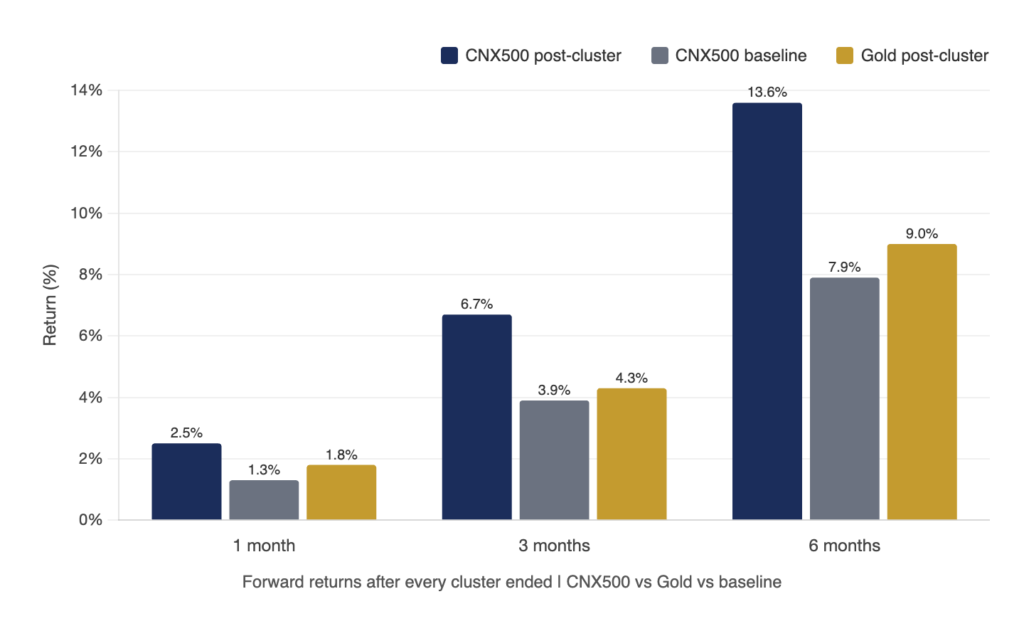
| Timeframe | CNX500 Post-Cluster Avg | CNX500 % Positive | CNX500 Baseline Any Period |
|---|---|---|---|
| 1 Month | +2.5% | 66% | +1.3% |
| 3 Months | +6.7% | 68% | +3.9% |
| 6 Months | +13.6% | 75% | +7.9% |
The 6 months following every volatility cluster delivered an average CNX500 return of 13.6%, nearly double the baseline of 7.9% for any random 6-month period. Three out of every four post-cluster windows were positive. Gold averaged 9% over the same windows with 74% positive.
The periods that felt most dangerous were historically the most rewarding periods to remain invested. Not occasionally but consistently, across all episodes spanning 20 years.
What This Means
The data tells a consistent story across 20 years of Indian market history.
Volatility is not noise. It arrives in regimes, concentrated in specific years, averaging 4.4 days per episode, and often followed by a recovery that rewards the investors who stayed. The years that produced the most clusters were followed, in most cases, by periods of above average returns.
During those cluster episodes, a three asset portfolio behaved as the data suggests it should. Equities fell, gold partially protected and liquid holdings preserved capital and maintained deployability. Not as a coincidence across a few events but as a pattern across clusters spanning two decades.
After every cluster ended, the 6-month return averaged 13.6% on CNX500 and 9% on gold, both above their long-run baselines. The liquid allocation that cushioned the fall became the dry powder that funded the recovery entry.