
1. Why asset allocation matters?
You ask any investor what drives long-term performance, and most will talk about stock-picking, timing, or fund selection.
But multiple studies – from Brinson (1986) to CIBC’s 2024 Long-Term Asset Allocation Report – prove something surprising:
“Over 90% of a portfolio’s long-term return and volatility are determined by its asset allocation – not by individual stock choices or timing.”
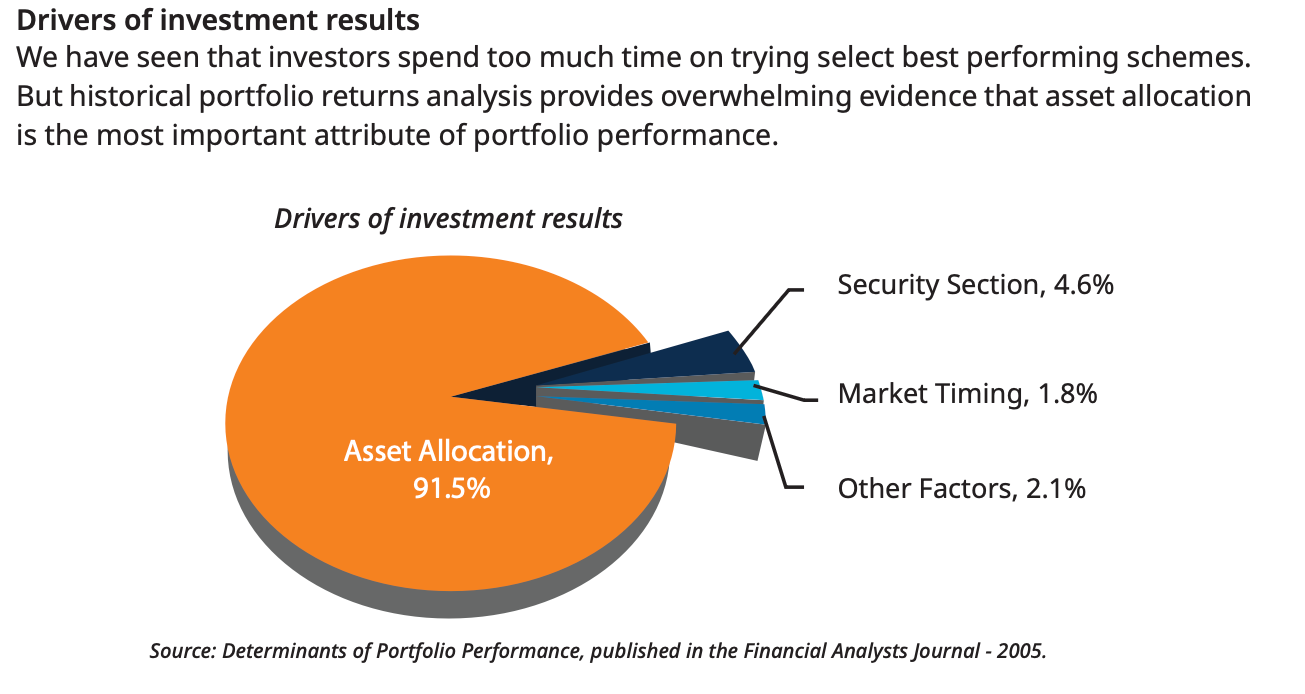
Asset allocation is the foundation that defines how much exposure you take to growth assets (equities), stability assets (debt), and hedges (gold, real estate, or alternatives).
It’s not about chasing the highest returns – it’s about crafting a mix that gives you the optimal risk-return balance that suits your risk-taking ability, and lets your money grow consistently no matter what the markets throw your way.
In essence, allocation is your investment DNA – it determines how resilient your portfolio is through bull runs, crashes, and inflation cycles.
2. But how does it work? What’s the logic?
Every asset class behaves differently:
Equities offer growth but fluctuate sharply.
Bonds stabilize returns through income and lower volatility.
Gold shines when uncertainty rises.
Alternatives (like real estate, private credit, or global funds) diversify further.
When you combine assets with low correlation, your portfolio’s overall risk reduces, because what falls in one period may rise in another.
This concept – “don’t put all your eggs in one basket” is not just another proverb; it’s the foundation of Modern Portfolio Theory.
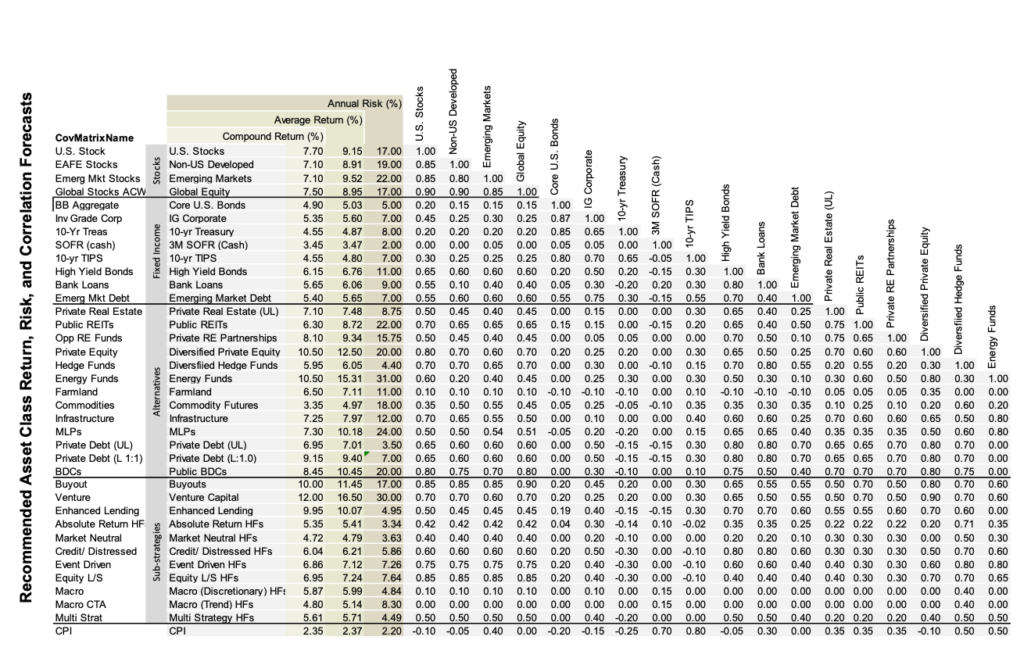
Source: CIBC
The correlation matrix above shows how different assets move in sync with one another. One should have exposure to uncorrelated assets as part of their core portfolio.
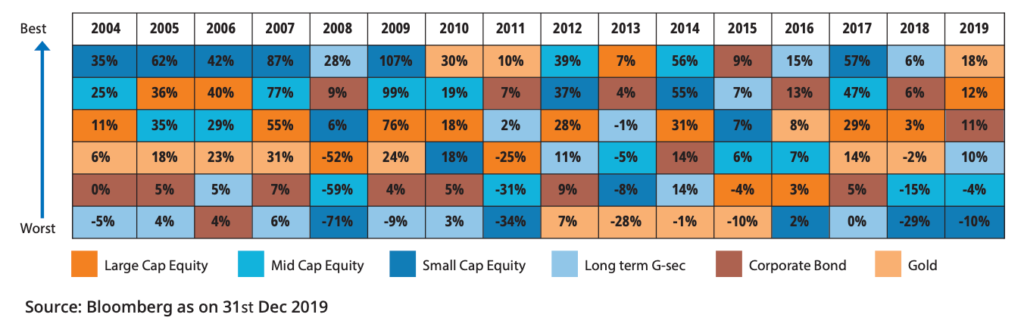
The MFS 20-year diversification chart makes this clear: no single asset class leads every year. Leadership rotates – sometimes equities dominate, sometimes bonds or commodities. Yet, the diversified portfolio consistently stays near the top – never the best, never the worst, but always reliable.
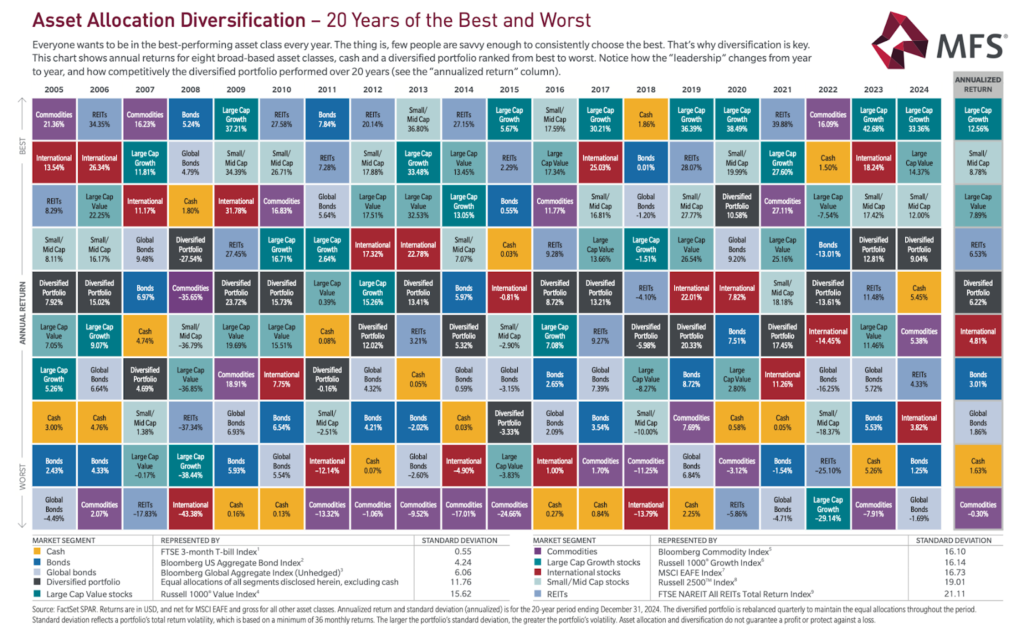
Different asset classes outperform/underperform each other in different stages of investment cycles. If we follow the right strategy and have a balanced asset allocation approach, we can generate consistent returns and portfolio stability.
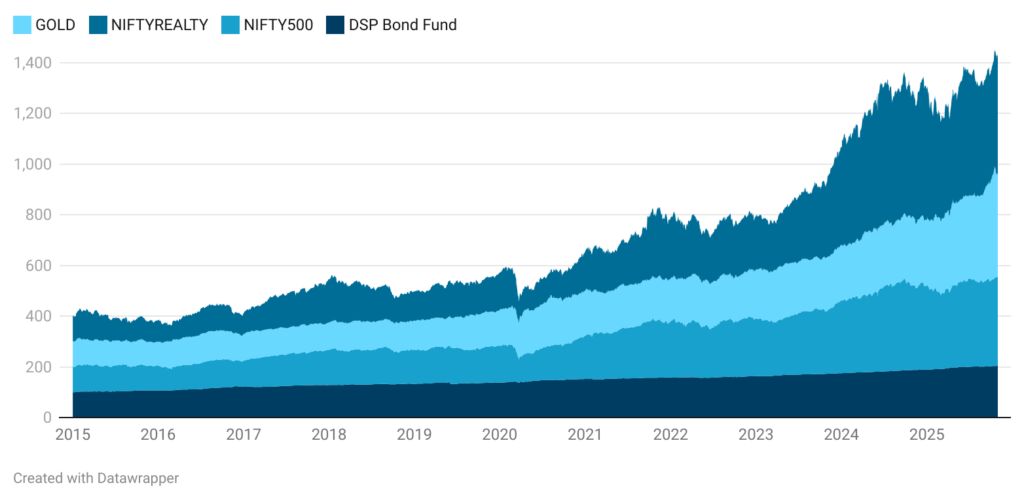
The chart below compares the performance of Gold, NIFTY Realty Index, NIFTY 500, and DSP Bond Fund from 2015 to 2025.
Source: NSE
We’ve used NIFTY Realty Index as a proxy for real estate, acknowledging that it may not fully represent the broader housing market – certain regions have seen explosive growth while others have remained flat. Still, it offers a reasonable reference point for how the real estate sector as an asset class has evolved.

Source: NSE
This chart substantiates how market leadership constantly shifts across asset classes from year to year. Since no one can consistently predict which asset will outperform next, maintaining a diversified allocation ensures your portfolio remains balanced – with at least some part always participating in the year’s winners.
3. Multi-Asset Allocation has worked across countries
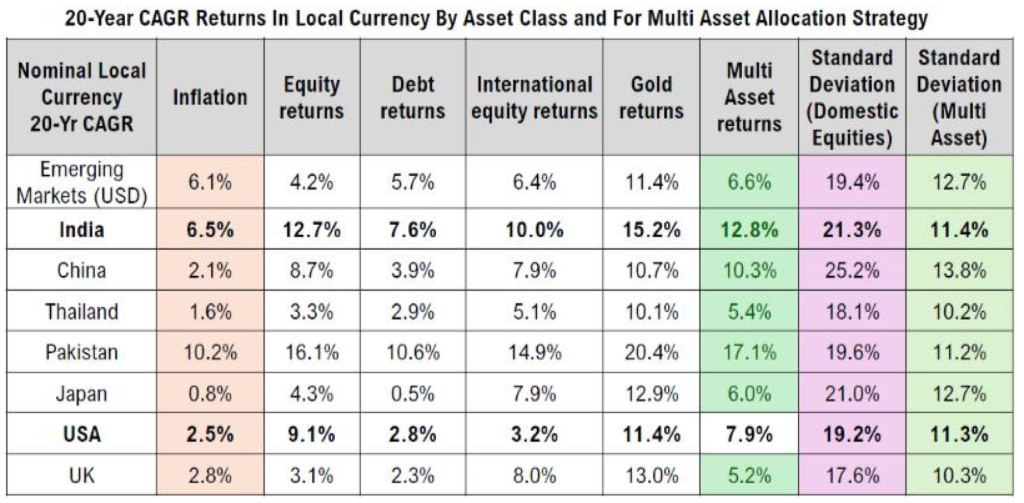
To understand the real-world effectiveness of diversification, let’s look at DSP Mutual Fund’s 20-year cross-country analysis (as of Oct 2025):
Source: DSP Mutual Fund
The table compares the 20-year CAGR returns (in local currency) across asset classes – equities, debt, international equities, and gold, alongside a multi-asset strategy that blends them.
Key Insights:
- India stands out with a 12.8% annualized return under a multi-asset strategy, higher than its pure equity return of 12.7% – but with almost half the volatility (11.4% vs 21.3%).
- Emerging markets (USD) show similar patterns – multi-asset returns of 6.6% versus equity returns of 4.2%, again with lower standard deviation (12.7% vs 19.4%).
- Even in developed markets like the US and UK, where equities have done well, multi-asset portfolios have offered comparable returns (7.9% and 5.2%) but with lower risk.
- For China and Thailand, the benefits are clear – the multi-asset approach provides stable, mid-to-high single-digit returns despite high equity volatility.
This table validates one critical point:
“A poor performance in one asset class is often balanced by stronger results in another, reducing overall risk.”
The combination of equities, debt, international exposure, and gold ensures that no single market cycle dominates your outcome – leading to smoother, more predictable returns over time.
4. Finding the Optimal Mix
Now comes the crucial question – how much of each asset is right for you?
Well, there is no one-size-fits-all solution. This “optimal mix” depends on risk appetite, time horizon, and financial goals.
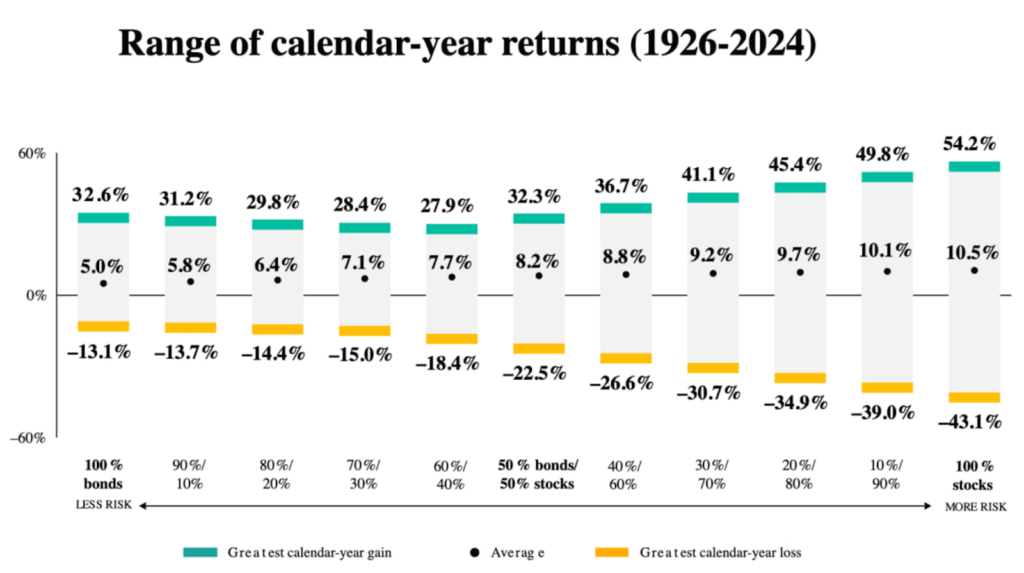
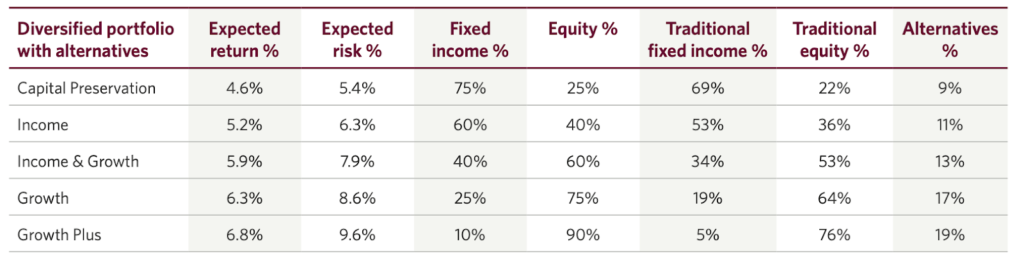
From CIBC’s long-term study and Baird’s allocation models, we see a simple truth:
The higher your equity share, the higher your expected return – and volatility.
The higher your debt share, the lower your risk – and potential growth.
For instance,
Source: CIBC
Even small tweaks (say, moving from 60/40 to 70/30) can change long-term returns meaningfully – while only modestly affecting risk.
In India, HSBC’s 40/40/20 mix (Equity/Debt/Gold) produced superior risk-adjusted returns, balancing growth, stability, and protection.
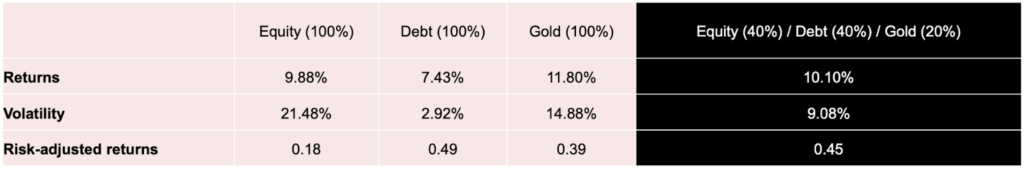
Source: HSBC
Hence, the “sweet spot” often lies between 60/40 and 70/30 for (Equity:Non-Equity) allocation – a blend that captures equity’s compounding while cushioning drawdowns.
5. Sensitivity analysis – How much equity is too much?
The table and chart below, together highlight how varying the mix of equity and gold affects a portfolio’s risk and return from March 2007 to March 2025. As the equity share decreases and gold increases, overall portfolio risk (volatility) steadily falls, but returns also begin to taper off.
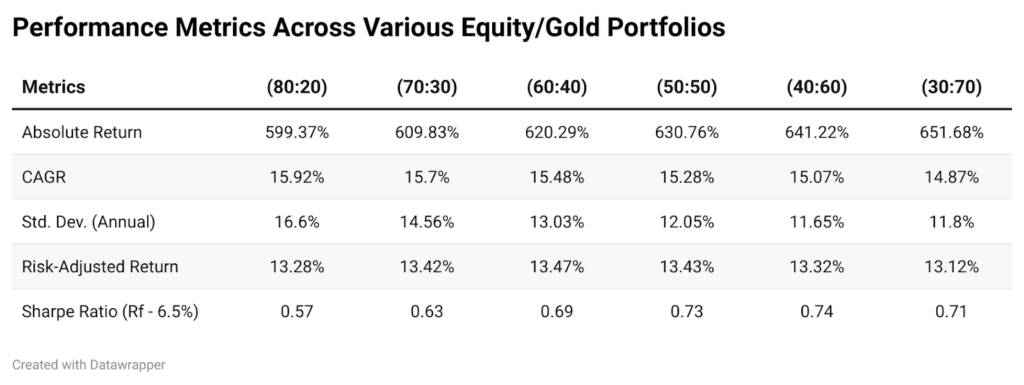
Data Simulation by Winvest Capital Research Desk | Source: NSE
While an equity-heavy portfolio like PF1 (80:20) delivers slightly higher returns, it comes with significantly higher volatility. On the other hand, a gold-heavy portfolio like PF6 (30:70) offers lower risk but also reduced long-term growth potential.
The sweet spot lies between PF3 (60:40) and PF5 (40:60), where the portfolios achieve the most efficient balance- PF3 scores best on risk-adjusted return, while PF5 delivers the highest Sharpe ratio, indicating superior efficiency in generating returns per unit of risk.
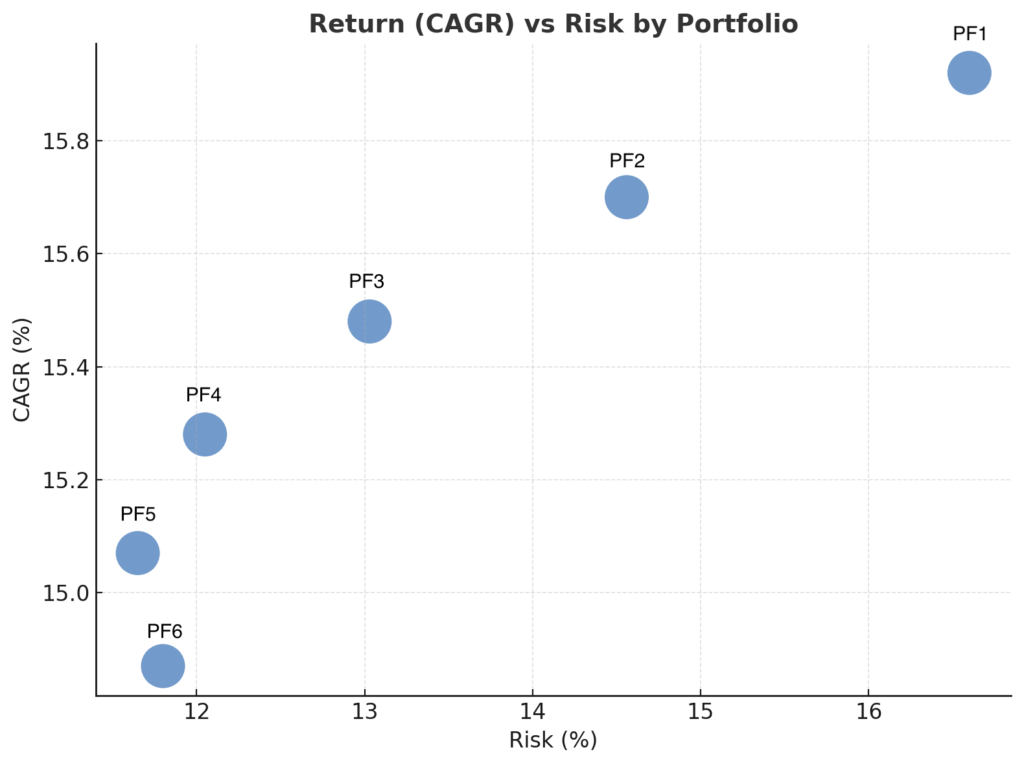
Data Simulation by Winvest Capital Research Desk | Source: NSE
This demonstrates that overexposure to either equity or gold is not optimal; beyond a certain point, the benefits of increasing one asset diminish, making a balanced allocation the most effective strategy for consistent, risk-efficient growth.
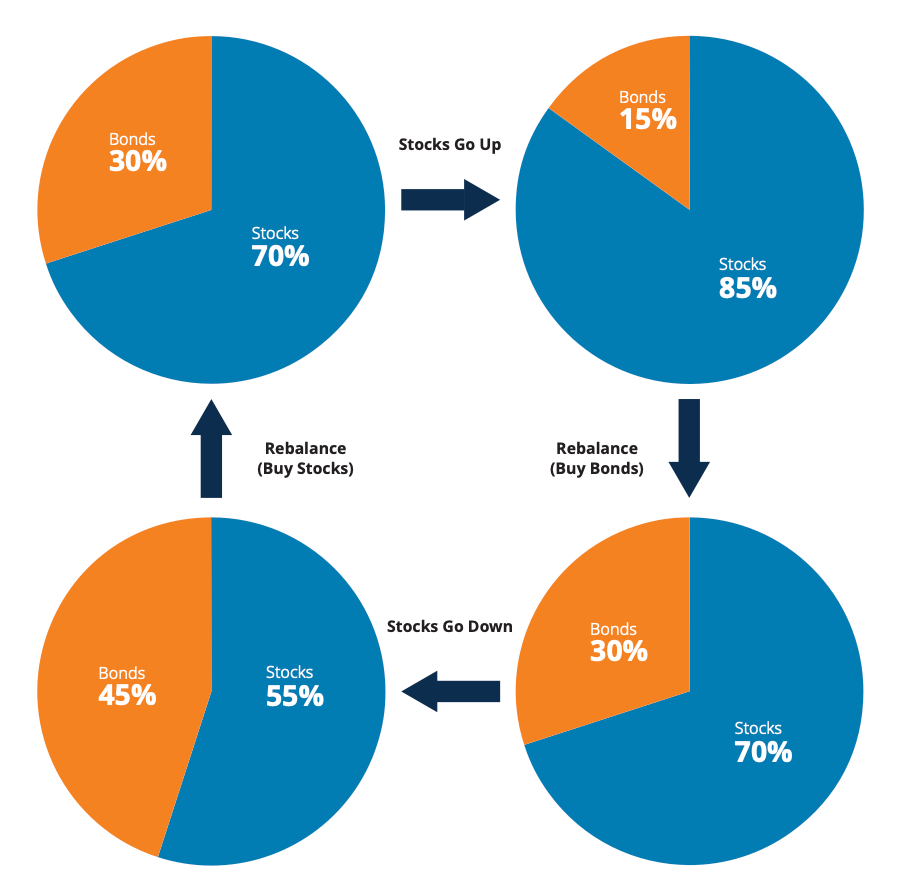
6. Rebalancing – why is it important?
Asset allocation isn’t a one-time decision – it’s an ongoing process.
Markets move. Equities rise, bonds lag, or gold rallies – and your portfolio drifts from its intended balance.
That’s why rebalancing, and periodically bringing allocations back to target is critical.
This Advisorkhoj case study is a perfect example:
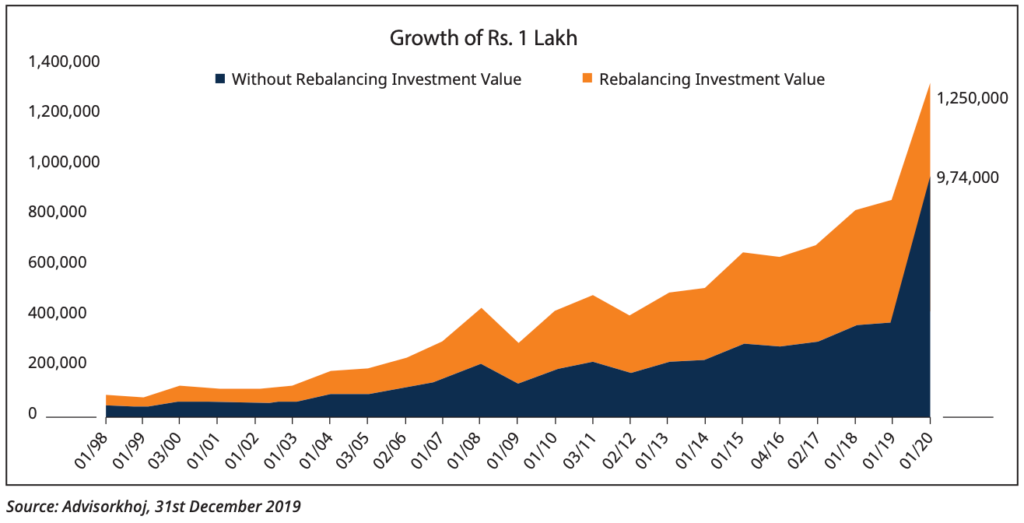
₹1 lakh invested in 1998 at 70% equity / 30% debt grew to ₹9.7 lakh by 2019.
With annual rebalancing to the same ratio, the same portfolio reached ₹12.5 lakh – 30% higher returns without added risk. The rebalancing strategy was very simple.
7. Crisis Testing
A true test of asset allocation is how it performs when the world panics.
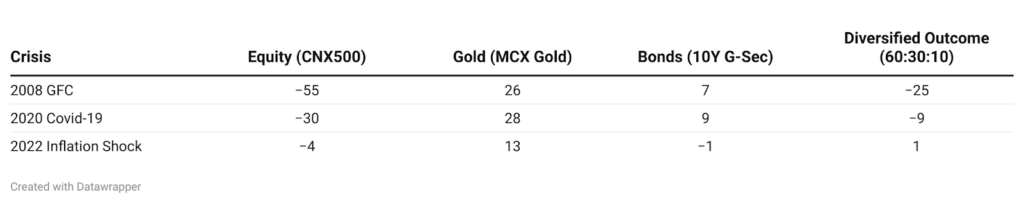
Source: NSE, MCX, HSBC
No allocation avoids pain completely. But a well-diversified one limits it – and recovers faster.
In 2008 and 2020, while pure equity portfolios lost nearly half their value, diversified ones saw manageable declines and regained their losses within a year.
Asset allocation doesn’t predict the storm, it protects you from it.
8. Alternatives & Global Assets
As markets evolve, so must portfolios.
Today’s investors can enhance diversification through alternatives and global equities.
CIBC’s 2024 analysis shows that introducing even 10-20% allocation to alternatives like private credit, infrastructure, commodities or real estate: increases expected return by ~0.5% annually, reduces correlation with equities, and smoothens volatility.
While such products are generally available for large institutional investors and UHNIs, one can explore exposure to global equities (via U.S., Europe, or Asia ETFs) or uncorrelated or lowly correlated commodities like Gold, and Silver.
These products give access to industries, currencies and assets unavailable in domestic markets – acting as a natural hedge against local shocks.
The world’s best portfolios aren’t built on what’s trending – they’re built on what’s uncorrelated.
9. The Indian Context
Despite rising financial awareness, Indian portfolios remain heavily skewed toward debt and cash.
As per HSBC’s 2023 report, nearly 70% of Indian household wealth sits in deposits, real estate, and gold – leaving little exposure to equities, which are the true engines of long-term compounding.
Source: CIBC
This stems from:
A cultural aversion to volatility, a preference for guaranteed returns, and recency bias after market drawdowns.
However, inflation quietly erodes the value of these “safe” assets.
Over the last 20 years, Indian equities have returned ~12-13% annually, while fixed deposits barely kept pace with inflation.
Balanced portfolios (like the 60:30:10 framework) offer a way out – giving equity exposure without sleepless nights.
10. Sample Frameworks (Only for reference)
While Asset Allocation is not a generic process, and one may need to consult a registered financial advisor. We can always use data and take inspiration from large institutions and build a sample portfolio of our own.
Using data from CIBC, HSBC, and Baird, here’s a simple guide for different investor types 👇
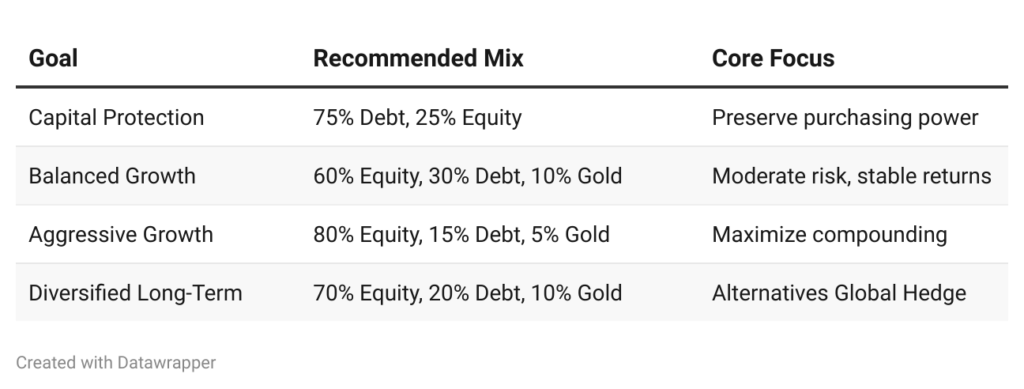
Each framework balances return potential, drawdown comfort, and diversification depth.
They aren’t one-size-fits-all – but they form a starting point for aligning investments with core objectives.
11. Key Takeaways – The Asset Allocation Playbook
- Allocation drives 90%+ of portfolio outcomes
- Combine assets that behave differently – that’s real diversification.
- Stay within your risk comfort zone – usually between 60/40 and 70/30.
- Rebalance annually to stay disciplined and unemotional.
- Add global and alternative exposure to strengthen resilience.
- Don’t chase returns – chase consistency.
- In the long run, time in the market matters. But how your money is allocated determines how you experience that time.