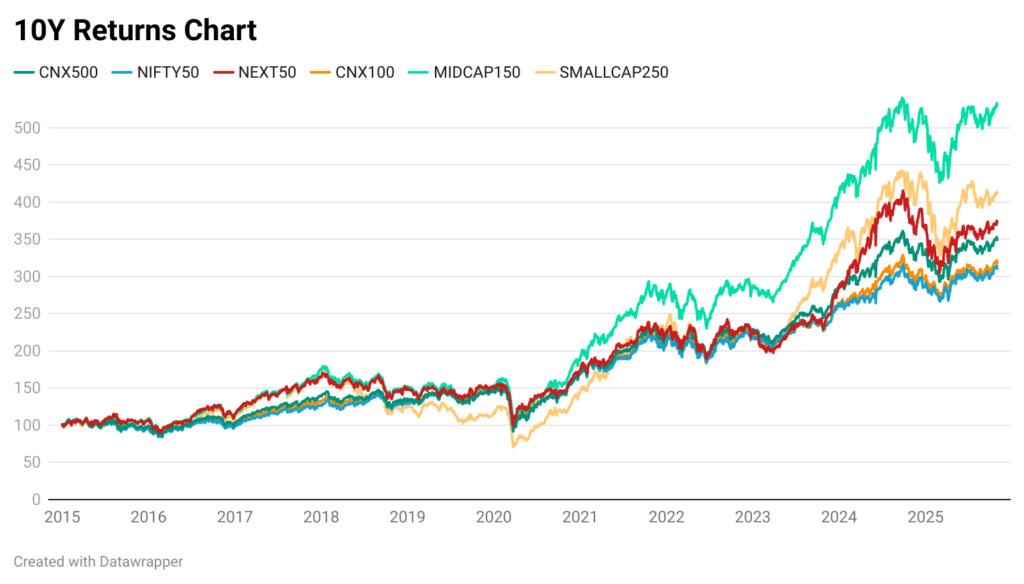
Over the last decade, Indian equities have delivered great returns.
But under these attractive long-term charts is a journey with deep drawdowns, long recovery cycles, and extended periods where portfolios remained underwater.
At the Winvest Capital Research Desk, we wanted to go deeper into this relationship between returns and the “price” investors pay for them across the major market-cap segments:
- Largecaps (Nifty50, CNX100, Nifty Next50)
- The broad market (CNX500)
- Midcaps (Midcap150)
- Smallcaps (Smallcap250)
Our objective was simple:
To understand not only which segment delivered higher returns, but what each segment demanded from investors in exchange.
And once we analysed the full 10+ year dataset, one insight became clear:
Returns are visible. Risk, drawdowns, and recovery time are not, but they are what truly shape investor outcomes.
Digging deeper, we analysed 10 metrics over a period of 10+ years, and these are our findings:
1) Returns: What investors see first – and often only
Across the last decade, the numbers appear straightforward:
CAGR (2015-2025)
- Midcap150: 16.62%
- Smallcap250: 13.94%
- Next50: 12.91%
- CNX500: 12.24%
- CNX100: 11.26%
- Nifty50: 11.02%
Absolute Returns
- Midcap150: 429.52%
- Smallcap250: 311.43%
- Next50: 272.70%
- CNX500: 249.40%
- Nifty50: 210.50%
- CNX100: 217.88%
At face value, these numbers suggest a simple hierarchy:
Midcaps > Smallcaps > Largecaps.
But financial markets rarely follow straight-line logic.
Returns illustrate the outcome. But what they don’t reveal is the journey.
To understand that journey, we must examine drawdowns, volatility, and time spent underwater.
2) Maximum Drawdowns: Where the true journey begins
Every investor loves the 20%+ up years.
But portfolios are built, and broken during the worst months.
We studied the maximum drawdowns across indices during the COVID crash, one of the fastest and deepest declines in market history.
Maximum Drawdown (During COVID Fall)
- Nifty50: -38.44%
- CNX100: -38.10%
- CNX500: -38.30%
- Next50: -41.96%
- Midcap150: -44.23%
- Smallcap250: -60.79%
The conclusion is humbling:
Smallcaps didn’t just fall more – they collapsed.
Midcaps fell harder than the broad market.
Next50 behaved more like midcaps than largecaps.
This is the first hint that higher return segments ask investors to endure significantly more pain.
3) RoMaD: The single cleanest measure of “return earned per unit of pain”
RoMaD = Return / Maximum Drawdown
When we compare across indices:
- Midcap150: 0.38 (Best)
- CNX500: 0.32
- Next50: 0.31
- CNX100: 0.30
- Nifty50: 0.29
- Smallcap250: 0.23 (Worst)
This metric cuts through all noise.
Midcaps generate the best risk-adjusted returns, factoring in drawdowns. Smallcaps, despite high long-term returns, deliver the poorest efficiency when drawdowns are accounted for.
In behavioural terms:
Smallcap returns look attractive – but the pain induced to earn them is far greater than what most investors can realistically tolerate.
Can you sit through your 10L investment falling to 4L? Mostly not.
4) Volatility & Standard Deviation: Measuring the “everyday noise”
Annualised Volatility
- Largecaps: ~16.2%
- Midcaps: 17.6%
- Smallcaps: 19.38%
Smallcaps move more – in both directions. This amplifies emotions, especially during sideways and negative regimes.
Volatility doesn’t matter when markets go up. But it hurts when markets fall.
5) Sharpe Ratio & Risk-Adjusted Returns: How efficiently does each index compound?
The Sharpe ratio is a measure of an investment’s return compared to its risk. In very simple words, it tells you how much excess return you are getting for every unit of extra volatility (risk) you take on relative to an investment that is considered risk-free, such as a government bond.
Sharpe Ratio
- Midcap150: 0.58
- CNX500: 0.35
- Next50: 0.35
- Smallcap250: 0.38
- CNX100: 0.29
- Nifty50: 0.28
Risk-Adjusted Return
- Midcap150: 13.70%
- Smallcap250: 11.24%
- CNX500: 10.25%
- Next50: 10.57%
- CNX100: 9.43%
- Nifty50: 9.22%
Here lies one of the strongest findings of the study:
Midcaps offer the cleanest balance of returns vs. risk.
Smallcaps offer higher returns, but lesser efficiency.
In other words, midcaps provide “compounding you can actually stick with.”
6) Recovery Days: How long does each segment take to heal?
Studying drawdowns is only half the story. Recovery tells us how long capital stays idle.
Time to recover to the previous high from the deepest fall:
- CNX500: 158 days
- Nifty50: 158 days
- CNX100: 158 days
- Next50: 181 days
- Midcap150: 173 days
- Smallcap250: 279 days
Smallcaps take nearly double the time to recover compared to largecaps.
This is the longest “drag” investors face – emotionally and financially.
7) Rolling Returns: The true measure of consistency
We analysed rolling returns across 1M, 3M, 6M, 1Y, 3Y, 5Y, and 7Y windows.
Probability of making a positive return based on 1Y Rolling Returns:
- Nifty50: 84.99%
- CNX100: 81.78%
- CNX500: 78.82%
- Midcap150: 78.40%
- Next50: 69.89%
- Smallcap250: 65.41%
Largecaps clearly dominate consistency. Smallcaps struggle in short windows.
Let us look at it from a 3Y Rolling Return perspective:
- Largecaps: 97-98% positive
- Midcaps: 94% positive
- Smallcaps: 82.84%
5Y and 7Y Rolling:
At longer horizons, all indices converge above 99-100% positive.
This reinforces a timeless principle:
Volatility reduces with time, but only if investors stay invested long enough.
8) Monthly Behaviour: Where emotions peak and portfolios swing
Average Positive Month
- Smallcaps: +5.62%
- Midcaps: +4.78%
- Next50: +4.54%
- Largecaps: +3.7-3.9%
Average Negative Month
- Smallcaps: -5.89%
- Midcaps: -4.92%
- Next50: -4.44%
- Largecaps: -3.5 to -3.9%
Smallcaps exhibit both the strongest up months and the harshest down months.
Max Monthly Loss
- Smallcap250: -41.97%
- Midcap150: -37.17%
- Nifty50: -36.82%
- CNX500: -36.88%
This is where the small-cap journey becomes truly difficult. One bad month can erase multiple quarters of gains.
9) Correlation: Why diversification across market caps has limits
Correlation to CNX500:
- CNX100: 0.995
- Nifty50: 0.979
- Midcap150: 0.922
- Next50: 0.918
- Smallcap250: 0.860
Even smallcaps are 86% correlated to the broader market.
This means, diversifying across market caps may reduce concentration risk, but not market-direction risk. In a broad decline, everything falls – only the magnitude differs.
One needs to have exposure to uncorrelated assets like Gold and Debt to counter this risk. We have talked more about this in our previous blog. Read here.
11) Market-Cap Representation: What actually drives India’s equity market?
Overlap with CNX500:
- Nifty50: 49.84%
- Midcap150: 23.78%
- Next50: 18.22%
- Smallcap250: 10.84%
The broad market is dominated by:
Largecaps (~50%) and Midcaps (~24%), while Smallcaps, despite extreme volatility and investor fascination, represent only ~11% of the broad market.
This structural fact is often ignored in portfolio construction.
So what does all this mean for long-term investors?
These are our key findings:
1) Largecaps are the most reliable compounding engine
- Highest consistency
- Fastest recovery
- Lowest drawdowns
- Best short-term predictability
They form the backbone of any resilient portfolio.
2) Midcaps offer the best “return vs pain” trade-off
- Highest Sharpe ratio
- Strong CAGR
- Moderate drawdowns
- Superior RoMaD ratio
For long-term wealth creation, midcaps are the efficiency sweet spot.
3) Smallcaps are powerful – but demand exceptional behaviour
- Superior returns
- But deepest drawdowns
- Long recovery periods
- Worst short-term consistency
- Highest downside volatility
They are a “high return, high behaviour cost” segment.
Smallcaps reward patience, but punish impatience brutally.
4) The biggest insight from 10 years of data
Every index, be it large, mid, small – spends nearly 90% of its time below its previous high.
Compounding happens in short bursts. The real challenge is surviving the long stretches of drawdowns.
No ONE index protects investors from discomfort.
The only question is: How much discomfort can you handle, and for how long?
Hence, we conclude this study with a small quote – “Returns are what you earn. Drawdowns are what you pay.”
As we build and manage strategies at Winvest, these insights support our portfolio construction – balancing return potential with drawdown control, and choosing allocations where investors can stay invested through full cycles.
Wish to know more? Visit www.winvestcapital.in or get in touch at support@winvestcapital.in